
Published on April 29, 2013. Article written by .
Forecasting how your business will perform in the future can be tricky – many business owners give up in frustration if even try at all; fortunately the use of a 'rolling 12 month' average can help you identify trends that can be used to create a more accurate picture of how your business is performing.
Many business owners are graphical people. Just providing numbers on a page (e.g. a balance sheet and a profit and loss statement) don't really help business owners interpret 'what's going on.' Color coding numbers based on expectations sometimes help – however it is difficult to spot trends.
Many times the internal accounting team at a company will create charts and graphs. While helpful, even these when done monthly are difficult to interpret. Look at the following case study of a company that was experiencing cash flow issues but didn't know how to identify the product causing the problem. Below is a chart that depicts monthly product sales for 2012:
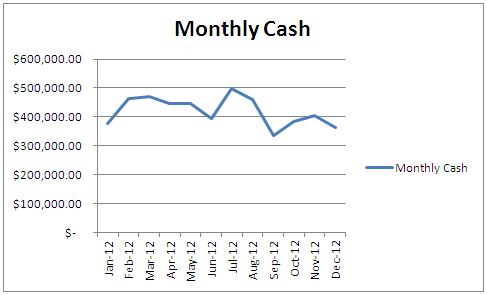
While the chart above does show some decline, if you were viewing the chart in the month of February, June, of early fourth quarter you might be inclined to believe that you had made some corrections.
Now look at the same data, but comparing 12 month periods (e.g. 2/1/2011 – 1/31/2012 is the first period, 3/1/2011 – 2/28/2012 is the second period and so forth):
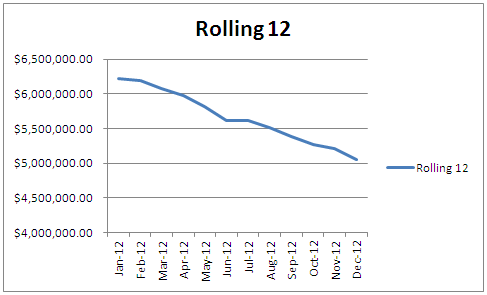
Now the problem is obvious and has been obvious for quite a while – sales are in a free fall!
Creating a rolling 12 month chart is relatively straightforward in MS Excel, simply record sales (or whatever you want to chart) each month, once you have 12 periods create a sum and use this as your data point. Very detailed instructions for automating this process can be found at: http://www.journalofaccountancy.com/Issues/2012/Jul/20125037.htm
Again – the whole point of the exercise is to take monthly fluctuations out of your analysis of performance so that you can know if you are truly growing or declining.
About the author:
Adam Boatsman is the Owner / Visionary at BGW Advisors.
CPA License: NC #34370
Learn more about Adam and the rest of our team on the Team page.